Figures: Chapter – APM
Application Performance Monitoring
How can anyone monitor so many background applications, servers, systems, and APIs, some owned, some operated by third parties? That task is made scalable for technical teams through Application Performance Monitoring (APM) tools. APMs provide everything from alerting to error reporting and detailed performance analysis. For example, a waterfall diagram shows the exact server requests and response communications that unfold in the seconds when a page on the site or in the app is loading and displaying.
See a performance issue or an error in the APM tool and want to know its impact?
With typical integrations between APMs and Digital Experience Analytics you can look at a seemingly problematic session in the APM tool and then click to replay the exact session via experience analytics. This enables you to verify how the errors and performance issues manifested themselves in the experience of the customer.
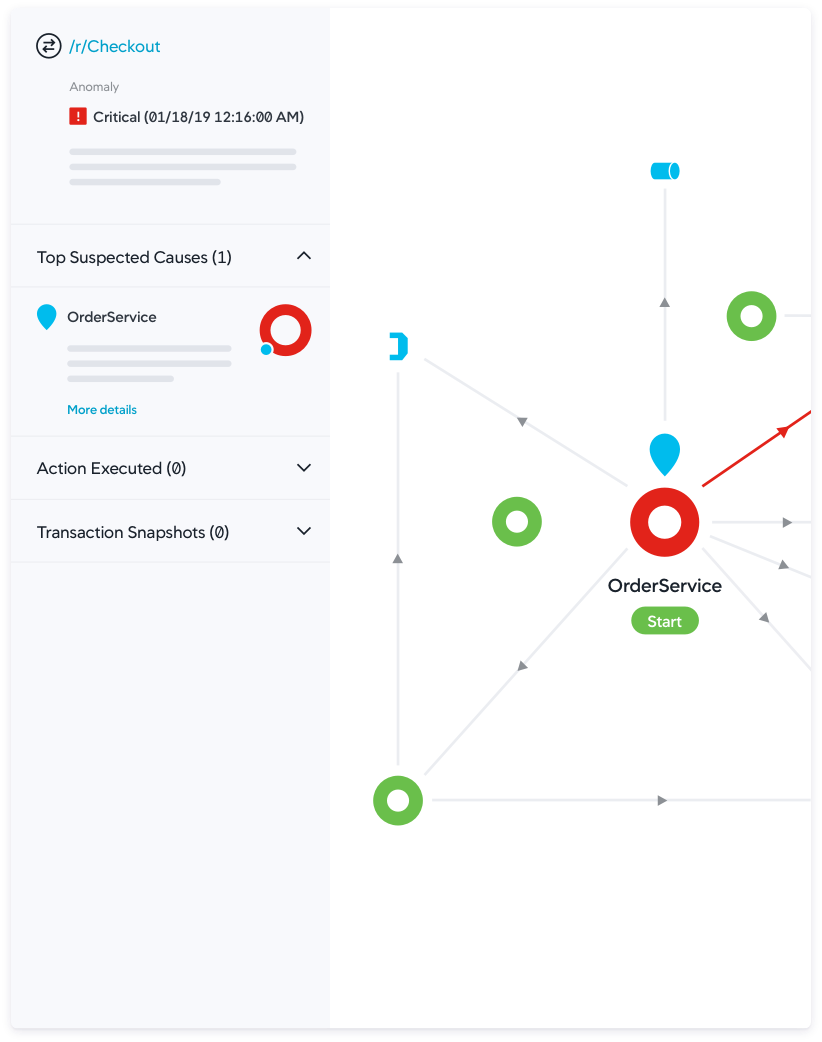
Here is an image of a leading APM solution, namely AppDynamics by Cisco. This example shows Root Cause Diagnostics. See more examples at AppDynamics.com.

Figure: AppDynamics, part of Cisco
Waterfall reporting example
A waterfall diagram is one of the most iconic examples of an APM report. It shows the exact server requests and response communications that unfold in the seconds when a page on the site or in the app is loading and displaying.
Figure: Waterfall report example from Contentsquare, CS Find & Fix, Speed Analysis
