Case Studies: Chapter 9 – Shoe retailer identifies and removes UX challenges for their shoppers
Why are some shoppers clicking add-to-cart unsuccessfully?
Clarks is a British international shoe manufacturer and retailer. It was founded in 1825 in the village of Street, Somerset, England, where the company’s headquarters remain. Today, they operate in 70 countries with more than 1.5 billion pounds of revenue in 2019. One of the values that the analytics team at Clarks credits Experience Analytics with is to help transform a nearly 200 year old business for the needs of the 2020s. They do this by stepping into their customers’ shoes and experiencing what they experience.
The Challenge
Everything was humming away pretty well on Clarks’ websites. But Craig Harris, Data & Analytics Manager at Clarks, and his team were systematically investigating what could go even better at each journey stage.
That’s when in this case study, they also took a look at the Product Display Page (PDP), which is a bit like a virtual fitting room for their customers.
Step 1: Understand in-page behaviors
When doing a top-down analysis of the experience on a given page, the in-page behavior visualization of choice is Zone-based Heatmaps. This is because their metrics show behaviors in aggregate in a way that session replay does not.
In this case, using the click rate metric, Clarks were able to see that a smaller number of visitors were interacting with the ‘Select Fit’ option (16.1%) than the ‘Add to Bag’ (17.1%), yet the “Select Fit” button is a required step.
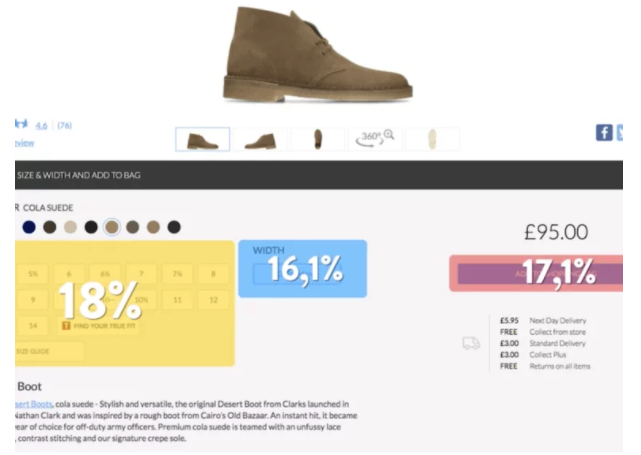
Image: Zone-based heatmap on the Clarks PDP in 2017
As a proper shoe manufacturer, Clarks offers many shoes in several options for width. So, by knowing the context of their site and business, they knew that these clicks on add-to-cart could not succeed because shoppers had not picked the shoe fit yet.
These days, automated frustration scoring would surface this issue without the need for any analysis, simply by detecting multiple interactions with the add-to-cart button on this page.
Step 2: Validate with session replay
Once the behavior has been understood at the macro level, a drill-down into session replay becomes a more effective way to confirm the insights. It showed how many of these customers would gloss over the width selection and head straight to the add-to-cart button after picking the size. However, the add-to-cart is grayed out because the customer hasn’t completed their choice for a shoe width.
Step 3: Quantify the impact
While it’s always good to remove any friction from customers’ experiences, analytics teams also need to prioritize where they ask their colleagues to update the site. There is always a long backlog of potential improvements, after all.
That’s where impact quantification comes in. It’s a simple comparison in conversion rates between those that tried to click add-to-cart before selecting a shoe width vs. those that did it successfully in the right order.
Definition: Creating sequential behavior segments
Here we have a great example of the value of sequential segmentation. In Experience Analytics tools that offer this capability, it enables analysts to define a segment of customers that, for example, first interacted with the shoe width zone “and then” interacted with the add-to-cart button afterward.
For analytics tools, it’s a more difficult segment to calculate compared to the much more common segments defined by a logical “and” condition. It is necessary for answering the tough questions, though. In this example, if we simply did an “and” based segment of customers that interacted with both elements, we wouldn’t be able to distinguish the ones that ran into trouble vs. those that didn’t.
A step further is “Directly then” segmentation. Here analysts are narrowing down not just on users that did something in a particular order but did it right one click after the next. For example, that is useful if you wanted to segment on users that viewed the cart page multiple times in a row – which can often be a sign of struggle.
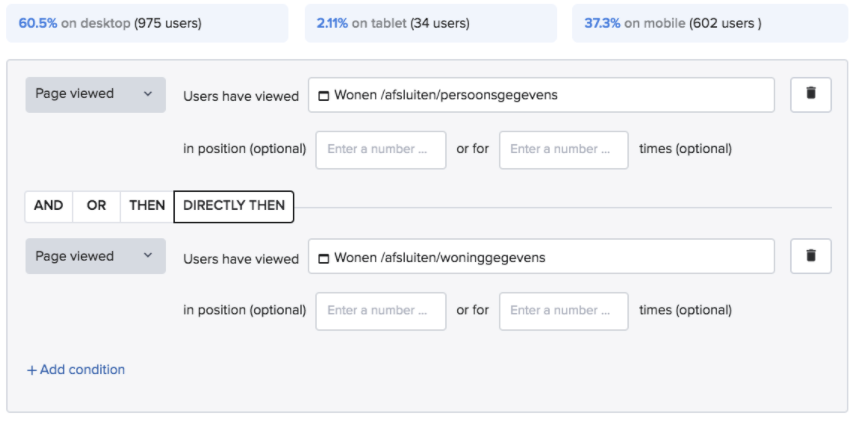
Image: Example of a sequential segmentation
The impact quantification revealed that many customers were confused and didn’t understand why they couldn’t add to the cart. As a result, many of them ultimately abandoned the site. A significant issue and a considerable opportunity to recover lost revenue!
Step 4: Hypothesize a better experience and then A/B test it
After seeing this behavior, Clarks changed the page to pre-select the standard width where only one width-fit is available anyways, i.e., standard. This increased the add-to-basket rate handsomely.
Following that success, they also tested preselecting the standard width on products with multiple fits. That showed a negative effect, however. So, they quickly reversed this test.
Results and value
This result lifted the add-to-basket ratio instantly. As Craig Harris summed it up: “In 2017 we saw an increase in annual sales of around £900k just from this one insight, so it’s a huge win for us which we’d have never been able to see easily if it wasn’t for Experience Analytics.”
The moral of the story
Your Analytics teams can do wonders – again and again – when they’ve got the right data. They are the best partners for the business. They are used to stretching traditional web analytics data as far as it can stretch by customizing its data collection tags. But the need to customize tags slows them down and doesn’t scale in practice. Most importantly, it doesn’t allow answering new questions retroactively.
As new questions arise every day, help the analytics help you by making sure they’ve got access to the right data.
Source: Clarks’s case study published on Contentsquare.com in 2017