Case Studies: Chapter 7 – Telecom Company
How a Telecom Resolved the Mystery of Why Customers Aren’t Finding What They are Looking for
Here is a typical analysis flow for resolving experience mysteries.
Challenge
This Telecom is also using Momentive as their Voice of Customer solution. They were asking customers the most natural question that we also often get asked in stores, namely, “Did you find what you were looking for?”
They noticed that a steady stream of customers answered negatively, i.e., they did not. So, of course, the Telecom wanted to find out what these customers were looking for and why they didn’t find it. How else could they act on this feedback?
Step 1: Understand the journeys of these customers
Not finding what you are looking for is typically a journey rather than a problem with a specific screen. So, instead of starting with anecdotal session replays, the Customer Feedback Management team visualized the journeys associated with customers that raised this concern vs. didn’t.
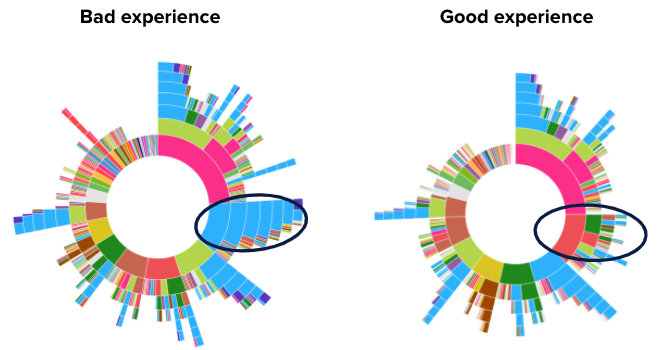
Image: Journey Analysis for the Telecom
The difference in behavior highlighted in the image jumped out from the visualization. Many customers who rated their experience poorly tended to spend a lot of time iterating on the pages for changing their mobile plan package (blue pages, highlighted).
Step 2: Replay experiences to understand why issues are happening
It’s at this point now where replaying the experience was helpful to understand why these customers seemed to be stuck on this page for changing their mobile package plan. The replays highlighted a JavaScript error that these customers encountered. They had to try multiple times and ultimately abandoned after failing to accomplish their goals.
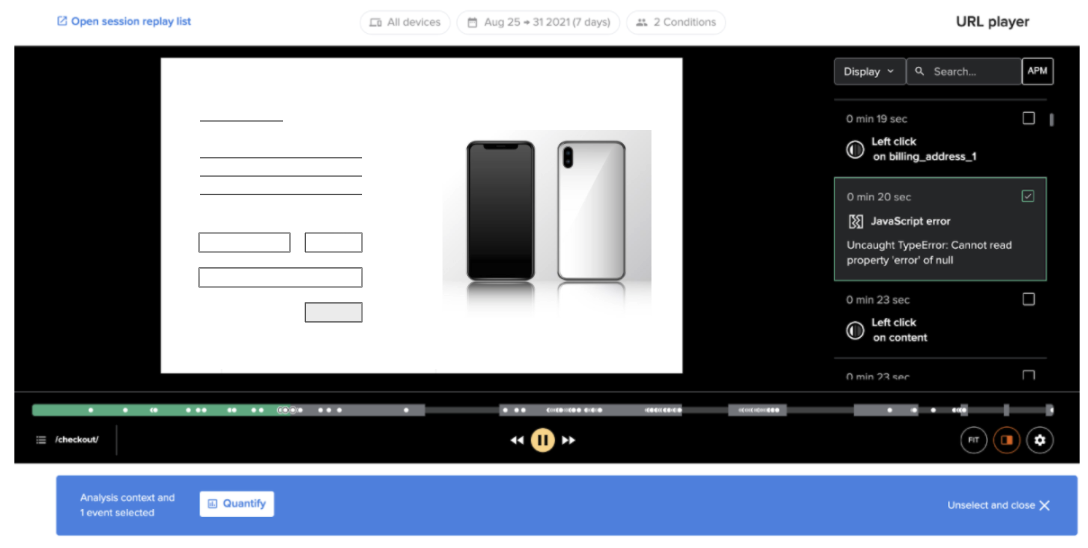
Image: Session replay example with JavaScript error (image is obfuscated for confidentiality)
Step 3: Impact Quantification
Seeing that this JavaScript error is hampering some customers’ ability to proceed, the question now is how many customers encounter this so the team can prioritize the issue ticket properly. Unfortunately, most websites have countless JavaScript errors that creep in, but most of them are not visible or noticeable to customers.
Running an impact quantification analysis, the Customer Feedback Management team compared the conversion rate of customers that did vs. didn’t encounter this particular error.

Image: Impact quantification compares customers who encountered the JavaScript error (first row) vs. those who didn’t.
The comparison highlighted that over 50,000 customers encountered the error per month and that their conversion rate was 0.67% lower than those that didn’t experience the error. That amounted to roughly 400 lost transactions per month or 5,000 per year lost due to the error.
Step 4: Action and value
The team prioritized the issue for resolution. Aside from saving the thousands of potentially lost transactions per year, the value is also for customer lifetime value and retention. The intent to change your mobile package is one that potentially puts customers at risk of switching to a different mobile carrier. A bad customer experience in such a moment is never a good thing.