Case Studies: Chapter 5, Flash Sales Site improves Acquisition by 22%
Case study: Flash sales site increases ad conversion rates by tailoring their landing pages to each advertising channel
The Flash sales company in our case study has been acquiring traffic via various paid and earned traffic sources. While they don’t sell vegetables, a flash sale is almost as perishable as vegetables are. When the sale is over, it is over.
The Challenge
So, how can they be as effective as possible with their ad campaigns and landing pages while the sale is going on?
Step 1: Generic landing page optimization
Using Experience Analytics they followed all the tricks from our previous case studies. They informed the best A/B tests to run for improving landing pages based on which content elements seemed best for engaging and persuading visitors. This improved conversion rates of their acquired traffic by 9%.
Step 2: A new challenge – what else can we improve?
Case closed? No. When the marketers looked back at their Google Analytics after the A/B tests, conversion rates still differed widely by acquisition channel … even on the same landing pages. Is that just the nature of the beast? Or, could there be an opportunity to tailor a better landing page to each acquisition source?
Digital Analytics, Acquisition campaign report
Illustration: The Flash sales site found lower conversion rates for paid advertising traffic
Step 3: Understand customers from different acquisition sources
In order to answer that question, we need to segment our Experience Analytics reports by traffic acquisition source. See the sidebar earlier in this chapter on how to do that.
Comparing side by side what content elements are engaging acquired traffic, the marketers at our Flash Sales site noticed something. Users from different traffic sources are attracted to different content elements and messages. Namely,
-
Visitors that found the Flash sale on their own via organic search were much more open to engaging with flashy banners after landing on the site.
-
In contrast, visitors that clicked through from a paid ad were much less likely to engage with these flashy banners. Instead, they were more attracted to the substantive information lower on the landing page.
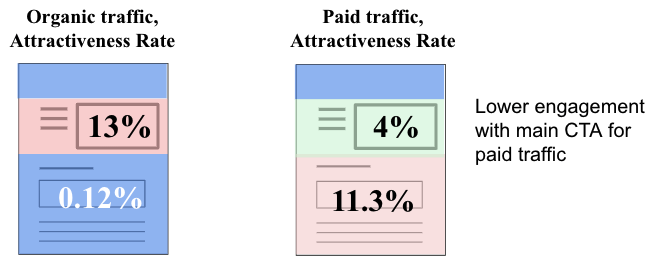
Illustration: Compare content attractiveness side by side for traffic from different acquisition sources
Step 4: Hypothesis and A/B tests
This led to the hypothesis that ad-driven visitors have their guards up after weighing the merits of clicking an advertisement. Organic visitors that found the site on their own are feeling much more confident about their research, perhaps even a little proud about their find. That’s probably why they don’t mind taking a risk by tapping a flashy banner on the site.
At the Flash sales site, this informed the next set of A/B tests that the marketers invested in. Now, they tested landing pages tailored to each acquisition source.
The value: A/B test results drive a 22% increase in acquisition
Before too long, the effort paid off big time. Conversion rate overall from acquired traffic improved by 22% vs. just a 9% uplift earlier from the generic landing page.
To realize how huge that is, imagine you could just increase your ad acquired traffic by 22% without spending an extra dollar on advertisement!
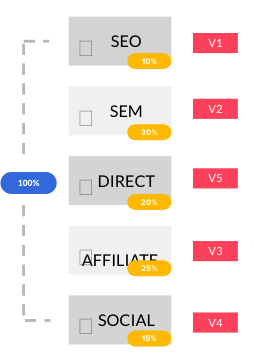
Illustration: The winning approach by tailoring messaging to different channels
The moral of the story
Customers aren’t all the same, and they don’t behave the same. Even if you only have one website or app — you have different sets of customers that expect different experiences. If we don’t understand our customers and what makes them tick, how can we hope to deliver the experiences that will make them and us successful?